
Shell Element Internal Forces/Stresses Output Convention
The six faces of a shell element are defined as the positive 1 face, negative 1 face, positive 2 face, negative 2 face, positive 3 face and negative 3 face as shown in the figure below. In this definition the numbers 1, 2 and 3 correspond to the local axes of the shell element. The positive 1 face of the element is the face that is perpendicular to the 1-axis of the element whose outward normal (pointing away from the element) is in the positive 1-axis direction. The negative 1 face of the element is a face that is perpendicular to the 1-axis of the element whose outward normal (pointing away from the element) is in the negative 1-axis direction. The other faces have similar definitions.
Note that the positive 3 face is sometimes called the top of the shell element in CSiBridge, particularly in the output, and the negative 3 face is called the bottom of the shell element.
The shell element internal forces, like stresses, act throughout the element. They are present at every point on the midsurface of the shell element. CSiBridge reports values for the shell internal forces at the element nodes. It is important to note that the internal forces are reported as forces and moments per unit of in-plane length.
The basic shell element forces and moments are identified as F11, F22, F12, M11, M22, M12, V13 and V23. You might expect that there would also be an F21 and M21, but F21 is always equal to F12 and M21 is always equal to M12, so it is not actually necessary to report F21 and M21.
The figure below shows internal F11 forces acting on the midsurface of a shell element. In the figure, the force distribution labeled (a) represents an actual F11 force distribution. The force distribution labeled (b) shows how CSiBridge calculates only the internal forces at the corner points of the shell element. Note that we could calculate these stresses at any location on the shell element. We simply choose to calculate them only at the corner points because that is a convenient location and it keeps the amount of output to a reasonable volume.
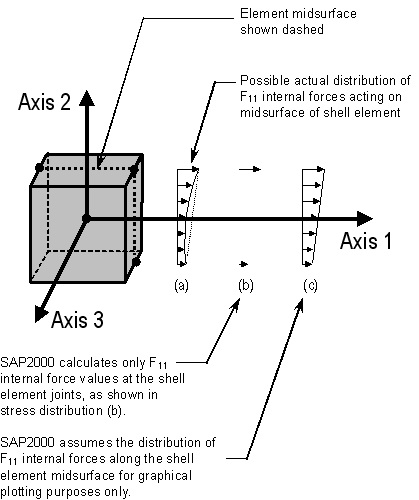
The force distribution labeled (c) in the figure above shows how CSiBridge assumes that the F11 forces vary linearly along the length of the shell element between the calculated F11 force values at the element nodes for graphical plotting purposes only.
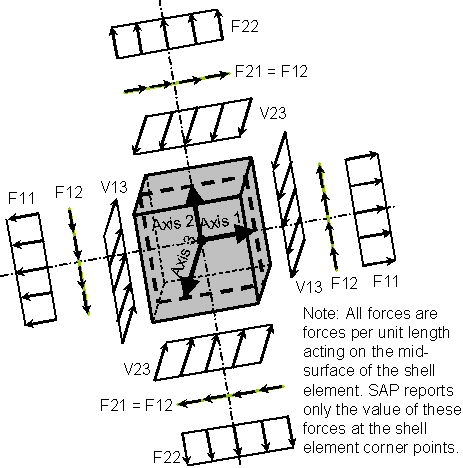
The figure below illustrates the positive directions for shell element internal forces F11, F22, F12, V13 and V23. Note that these shell element internal forces are forces per unit length acting on the midsurface of the shell element. CSiBridge reports only the value of these forces at the shell element corner points.
The figure below illustrates the positive direction for shell element principal forces, Fmax and Fmin. It also illustrates the positive direction for the shell element maximum transverse shear force, Vmax.
For values of V13 and V23 at any angle, the maximum transverse shear stress, V-Max, can be calculated as:
![]()
The figure below illustrates the positive directions for shell element internal moments M11, M22 and M12. Note that these shell element internal moments are moments per unit length acting on the midsurface of the shell element. CSiBridge reports only the value of these moments per unit length at the shell element corner points.
Use the right-hand rule to determine the sense of the moments shown in the figure above.
The figure below illustrates the positive direction for shell element principal moments, Mmax and Mmin.
See Also:
Shell Element Internal Stresses
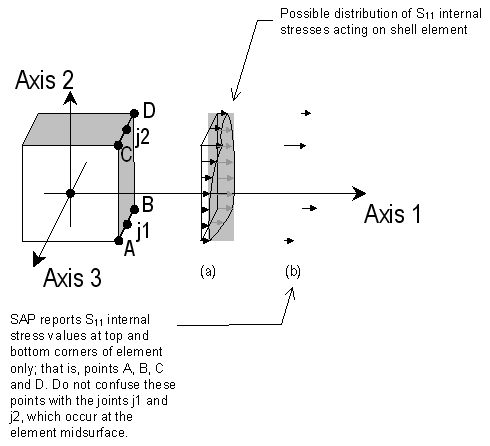
The basic shell element stresses are identified as S11, S22, S12, S13, and S23. An S21 might also be expected, but S21 is always equal to S12, so it is not actually necessary to report S21. Sij stresses (where i can be equal to 1 or 2 and j can be equal to 1, 2 or 3) are stresses that occur on face i of an element in direction j. Direction j refers to the local axis direction of the shell element. Thus S11 stresses occur on face 1 of the element (perpendicular to the local 1 axis) and are acting in the direction parallel to the local 1 axis (that is, the stresses act normal to face 1). As another example, S12 stresses occur on face 1 of the element (perpendicular to the local 1 axis) and are acting in the direction parallel to the local 2 axis (that is, the stresses act parallel to face 1, like shearing stresses). The figure below shows examples of each of these basic types of shell stresses. CSiBridge reports internal stresses for shell elements at the four corner points of the appropriate face of the element. For example, refer to Figure a below. On the positive 1 face internal stresses are reported by CSiBridge at points A, B, C and D.
Shell internal stresses are reported for both the top and the bottom of the shell element. The top and bottom of the element are defined relative to the local 3-axis of the element. The positive 3-axis side of the element is considered to be the top of the element. Thus in Figure a above, internal stresses at the top of the element include stresses at the joints labeled A and C and internal stresses at the bottom of the element include stresses at the joints labeled B and D. The Figure below clearly illustrates the points where CSiBridge reports the shell element internal stress values.
The transverse shear stresses calculated by CSiBridge (S13 and S23) are average values. The actual transverse shear stress distribution is approximately parabolic; it is zero at the top and bottom surfaces and has its maximum or minimum value at the midsurface of the element. CSiBridge reports the average transverse shear value. An approximation to the maximum (or minimum) transverse shear stress would be 1.5 times the average shear stress.
The figure below illustrates the positive directions for shell element internal stresses S11, S22, S12, S13 and S23. Also shown are the positive directions for the principal stresses, S-Max and S-Min, and the positive directions for the maximum transverse shear stresses, S-Max-V.
For values of S13 and S23 at any angle, the maximum transverse shear stress, S-MaxV, can be calculated from:
![]()


